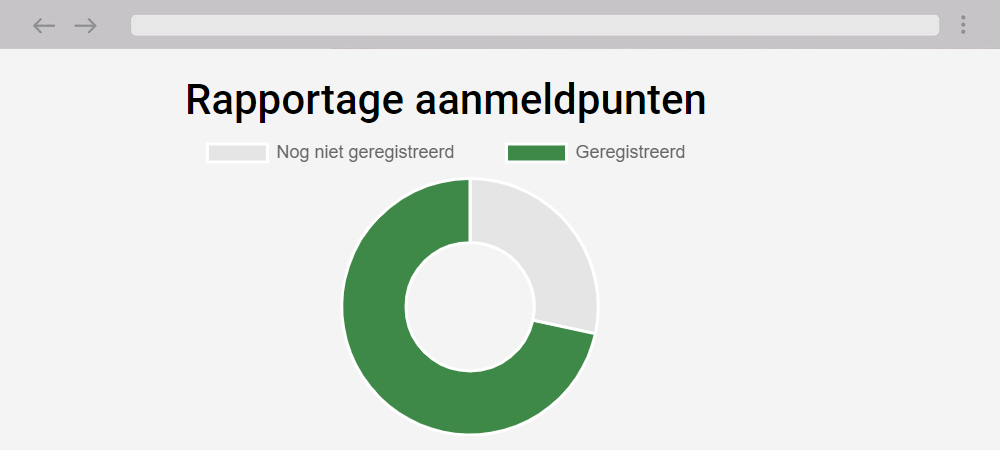
You receive real-time insights about the result of each campaign per e-mail campaign. View the statistics to find out how many mails have been delivered, the bounces and who opened the mail.
Reports
Email campaigns
Register shows/no-shows
Register the shows/no-shows upon receipt of the event by scanning the personal e-tickets. Do you also organize workshops? Then you can also consult the attendees and absentees here for each part of your event. Handy for evaluating the event afterwards. This way you know exactly which guests were present and you can follow them up.
Export
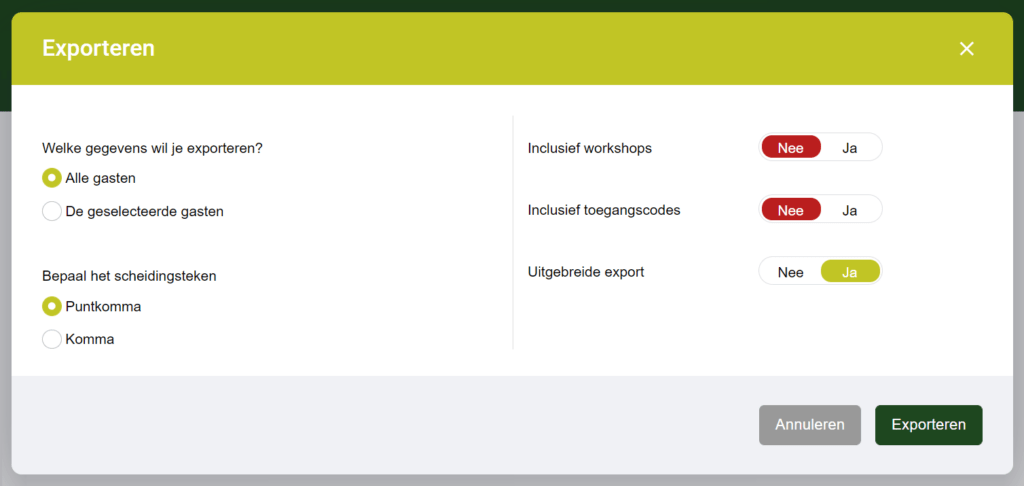
Easily export the various statistics to Excel or CSV. You choose how the graphs are displayed. Export individual charts or their sum. This way you always have an up-to-date overview of, for example, the participants.
Registrations
View detailed real-time statistics about your invitees. See at a glance how many registrations and cancellations there are and who has paid. You can see separately how many registrations there are for each workshop.
Survey
Evaluate the success of an event with a survey. Stay informed of the results in real-time, individually or as a group. You choose whether the guests participate anonymously in the survey or whether their personal data is kept. Make events measurable against KPIs by using open, closed and multiple choice questions.
Event website
Gain insight into the total number of website visitors and the number of visitors per page with a link with an analytics tool. See how visitors ended up on your event website. Via the invitation in the mail or directly via a search. When adding a new event website, you indicate whether the event website may be indexed by search engines such as Google and Bing.

Realtime inzicht in het aantal gasten dat aanwezig is

Exporteer de realtime gastenlijst
Interesting feature? Schedule a live demo!
Plan a callHow can I use statistics and reports?
Halito! collects extensive statistics throughout the process. These statistics are transformed into reports. You can use these reports to analyze the effectiveness (ROI) of the event and the communication. For each e-mail campaign, you gain insight into how many mails have been delivered, which ones have bounced and who opened the e-mail. This way you can split test with your mail campaigns. If guests register upon arrival, you can also gain insight into the show/no-shows. Are you curious about how many people have registered in relation to the number of visitors on your event website? Then use the Halito! Analytics tool. Also not unimportant is the number of registrations that you can see at once in Halito!. You can use all these insights to make your next event an even bigger success!
Double-check whether this feature meets your expectations
Ask Bart your question
Frequently asked questions
By default, no statistics are kept, but link your favorite tools to the event website. This way you optimize event websites and online campaigns based on clear insights.
You can consult statistics for each e-mail campaign that you send, so that you have insight into the delivery and can make adjustments if necessary. This way you can see which emails have arrived correctly, were opened and much more.
Listen to the guest experience to help your next event align even better with their expectations. Make events measurable against KPIs by using open, closed and multiple choice questions.